MARCH 2026
The State Investment
The Florida Legislature moved $5 million into racetrack purses for Florida-bred racehorses in 2026 – $4 million to Gulfstream Park and $1 million to Tampa Bay Downs.
Some of that state funding was already flowing in prior years. After accounting for preexisting allocations and reserves, the net new investment is $4.8 million at Gulfstream Park and $536,000 at Tampa Bay Downs.
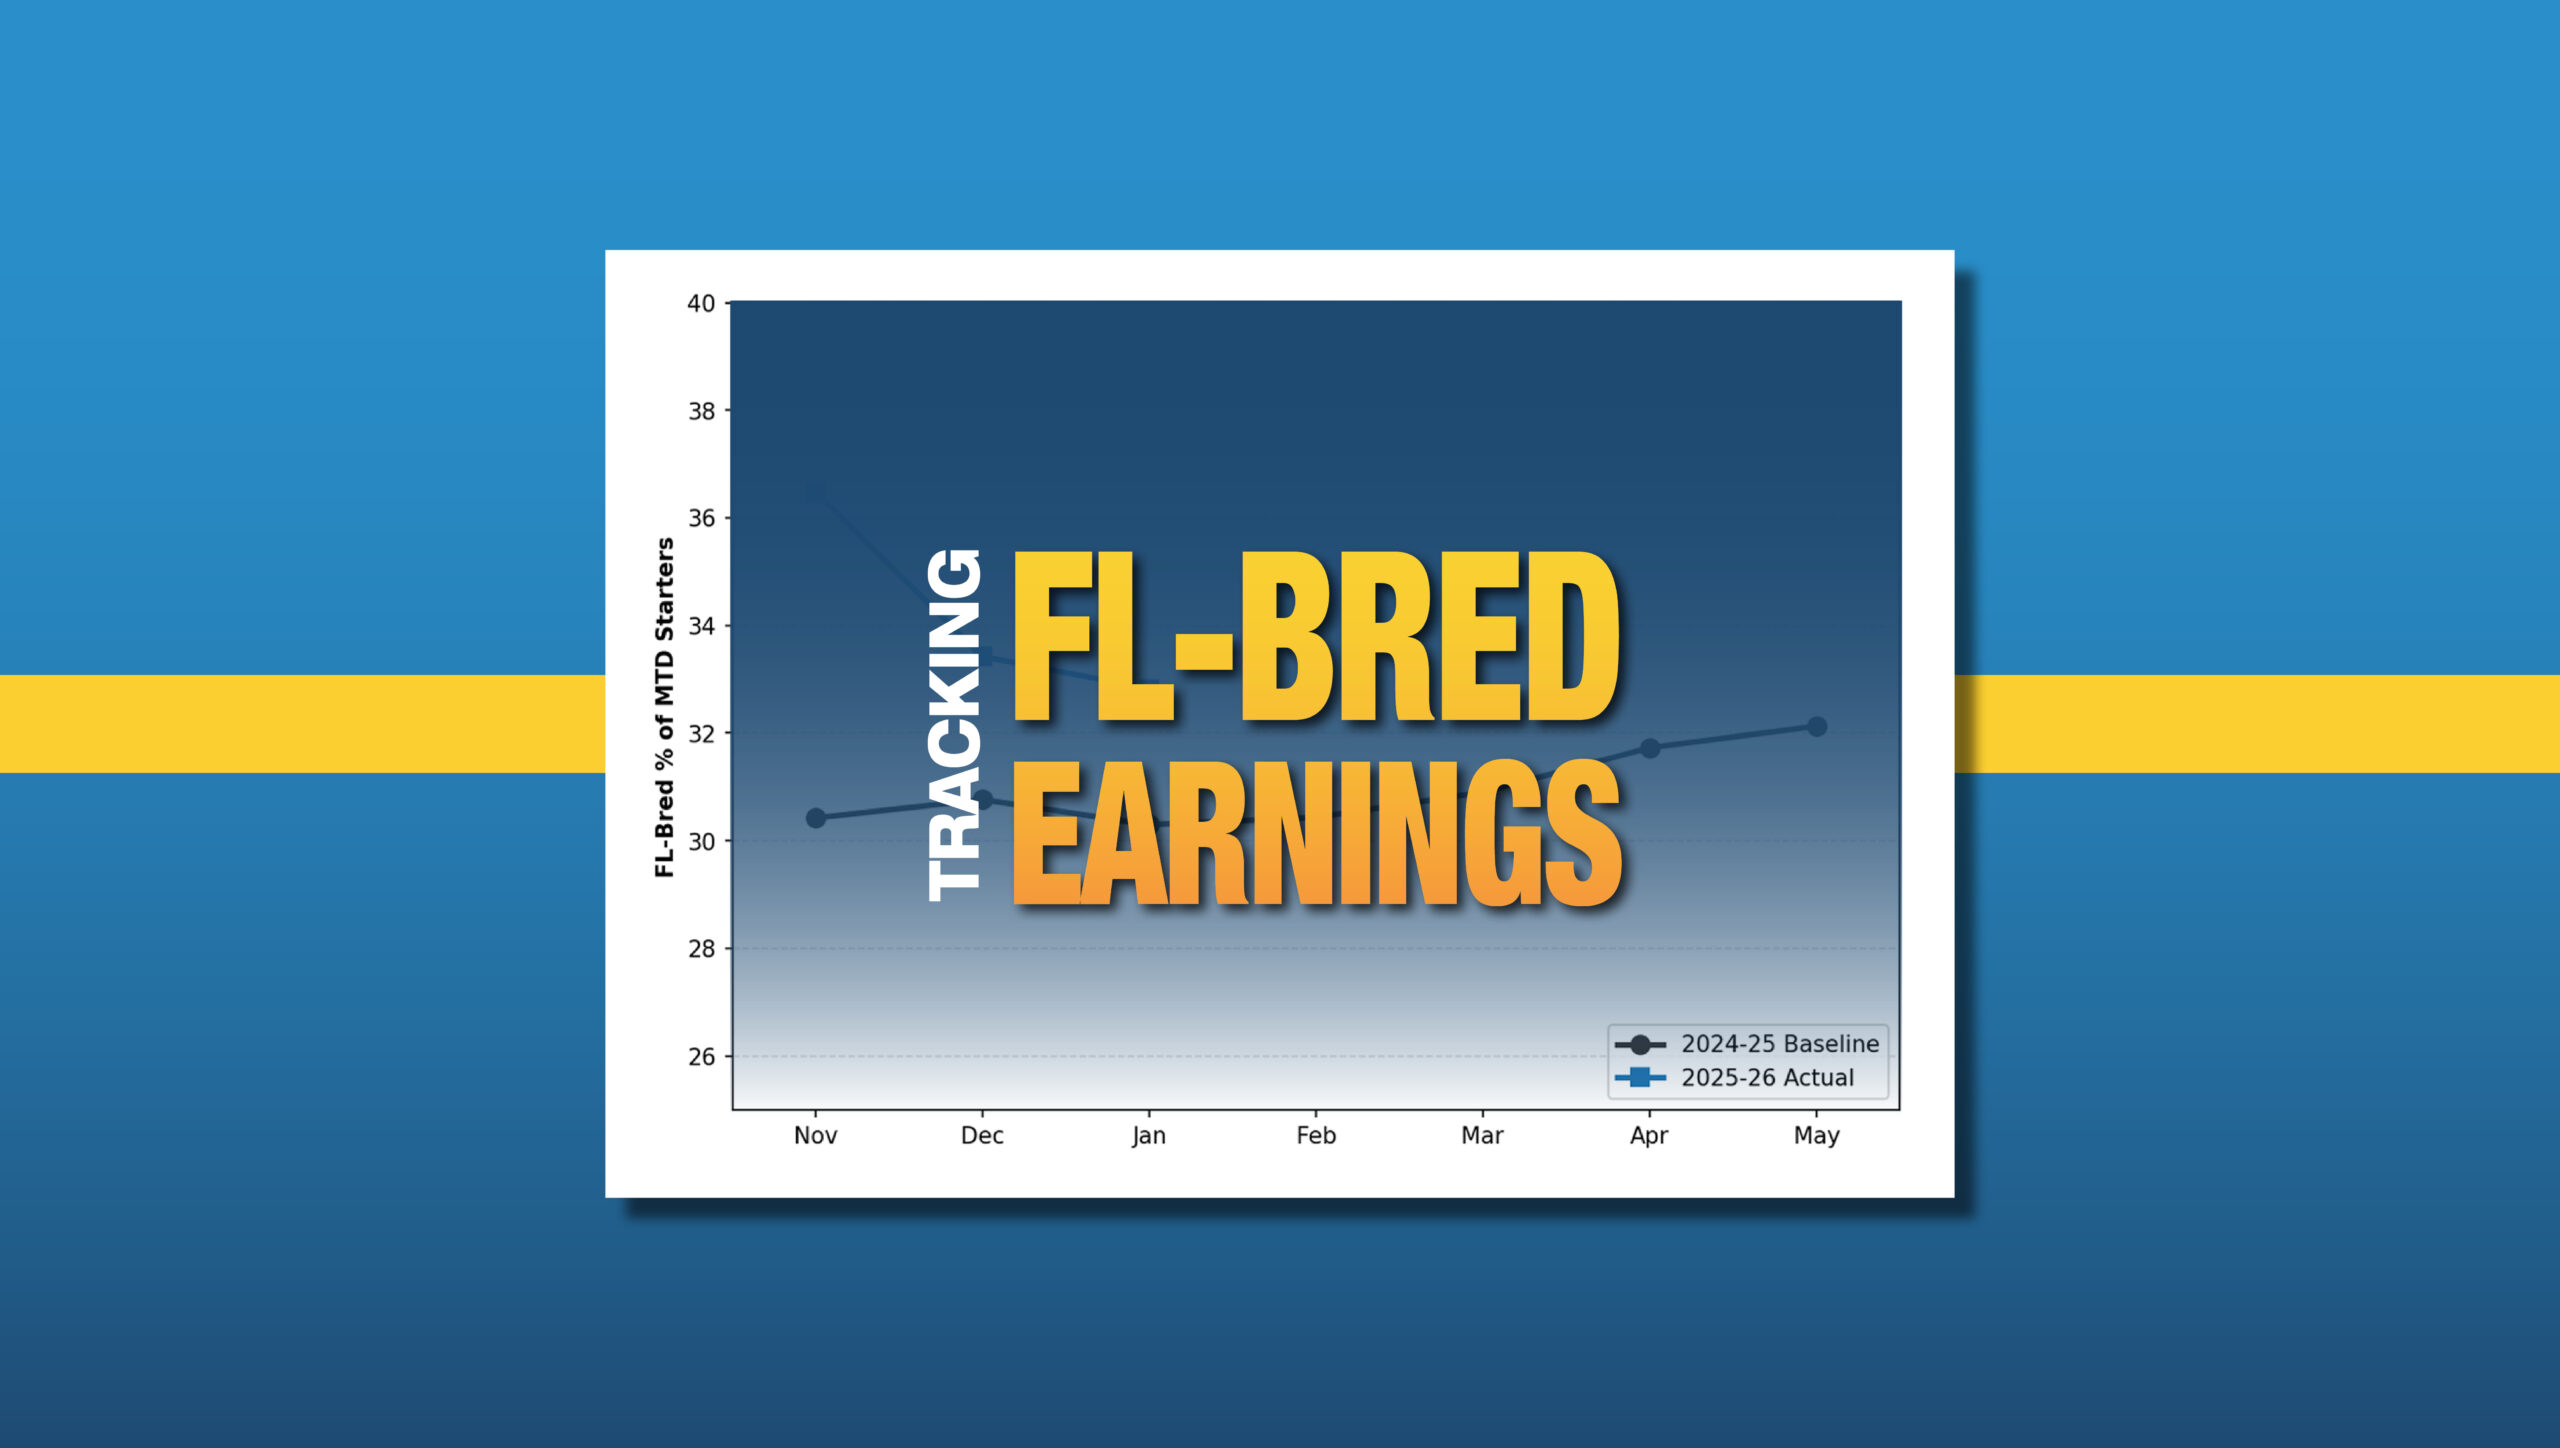
FTBOA is tracking how this investment translates into additional earnings for Florida-breds.
The Framework
We start with what Florida-breds earned at each track before the new state money arrived. That’s the baseline.
Adding the new state allocation to the baseline gives us the expected 2026 Florida-bred earnings. Because earnings don’t accumulate evenly through the year – some months have more racing, richer stakes, or different field compositions – we proportion the expected trajectory to match the historical weekly pattern rather than assuming a straight line. Baselines are adjusted where schedule changes affect comparability.
TAMPA BAY DOWNS
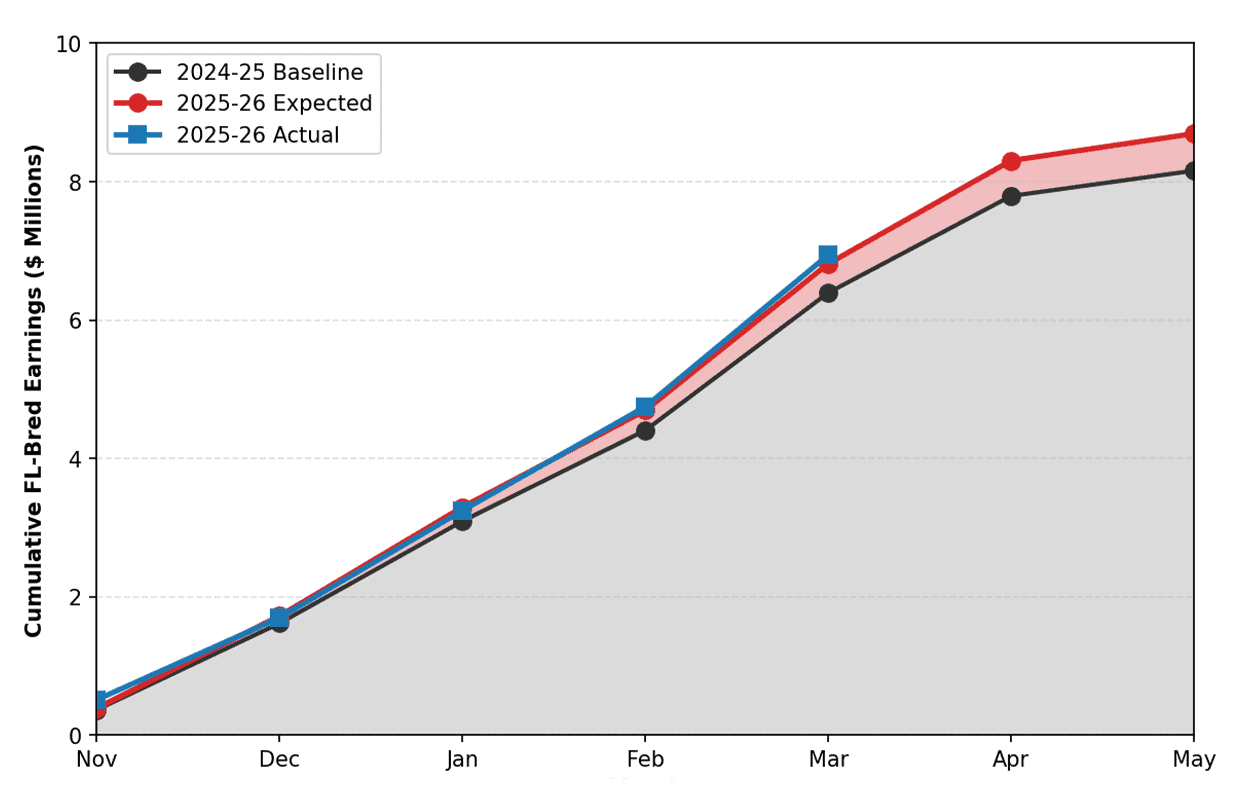
• 2024-25 meet baseline: $8.2 million
• Plus net new state allocation: $500,000
• 2025-26 Expected Florida-Bred Earnings:
$8.7 MILLION
GULFSTREAM PARK
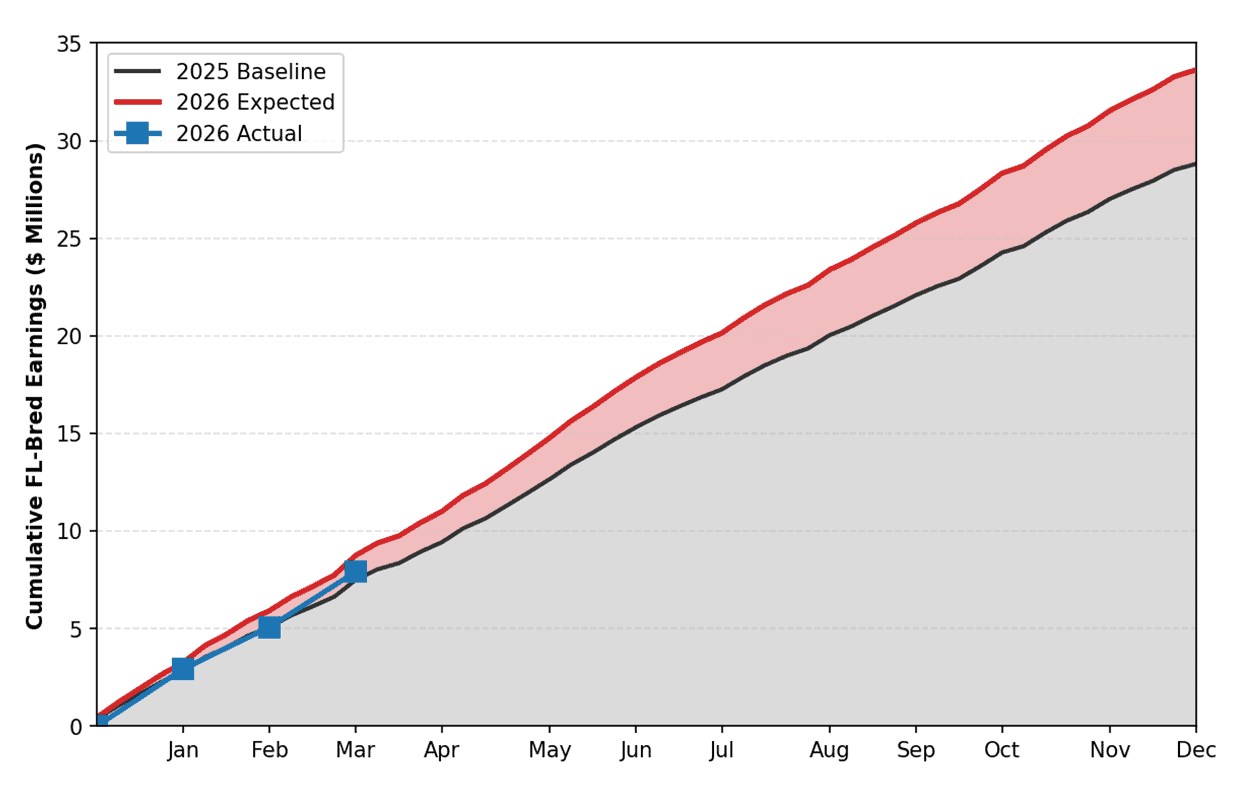
• Adjusted 2025 baseline: $28.8 million
• Plus net new state allocation: $4.8 million
• 2026 Expected Florida-Bred Earnings:
$33.6 MILLION
Reading the Charts
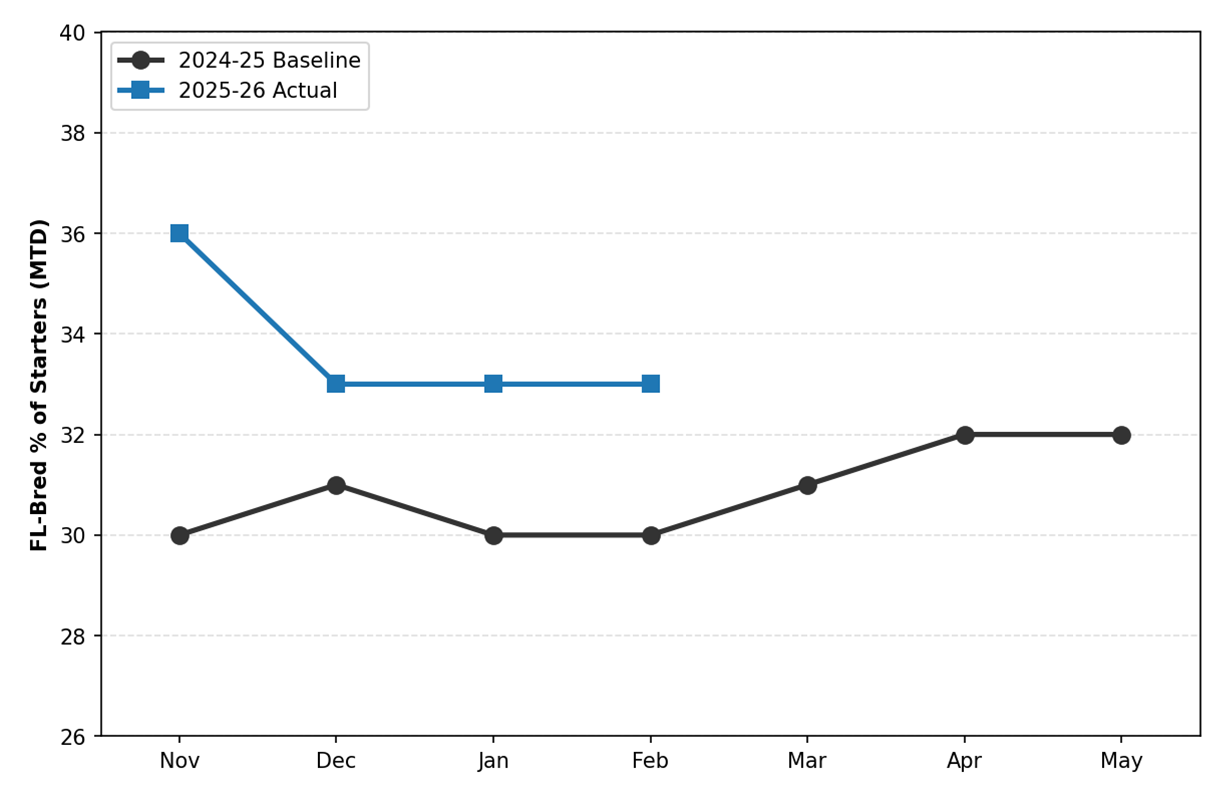
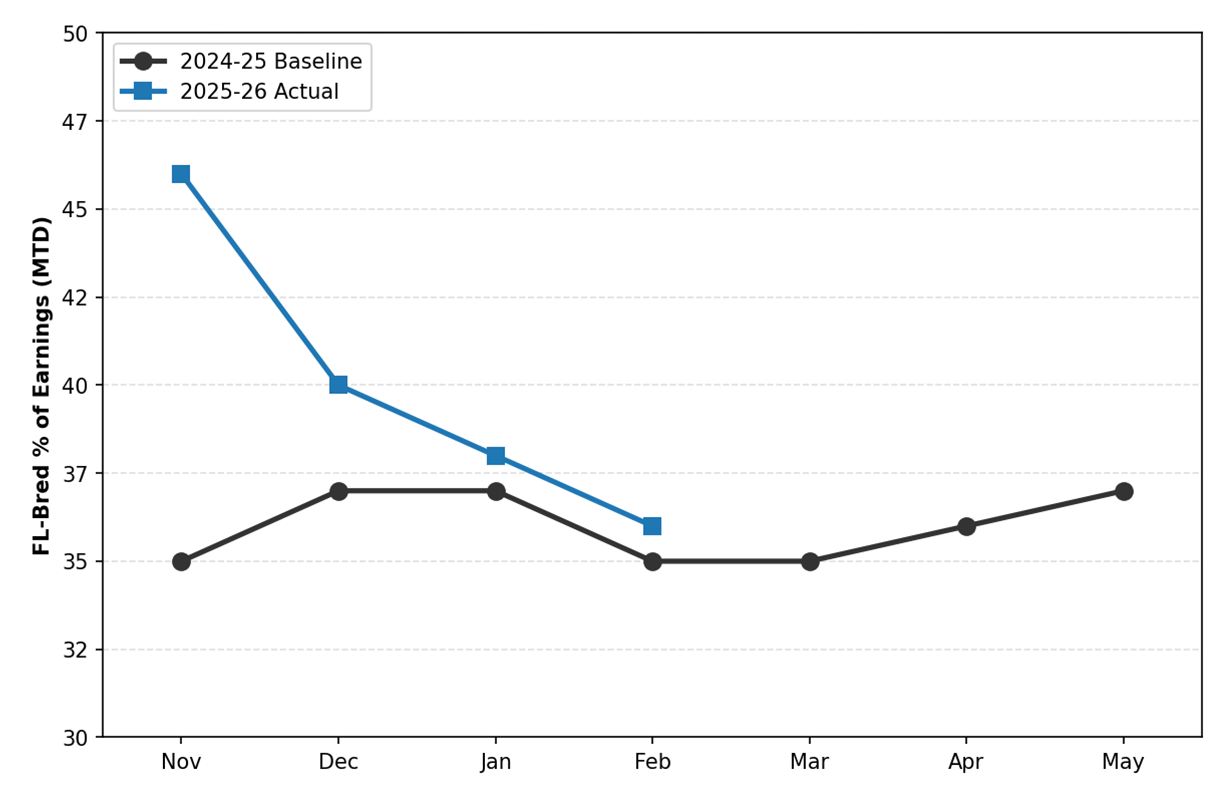
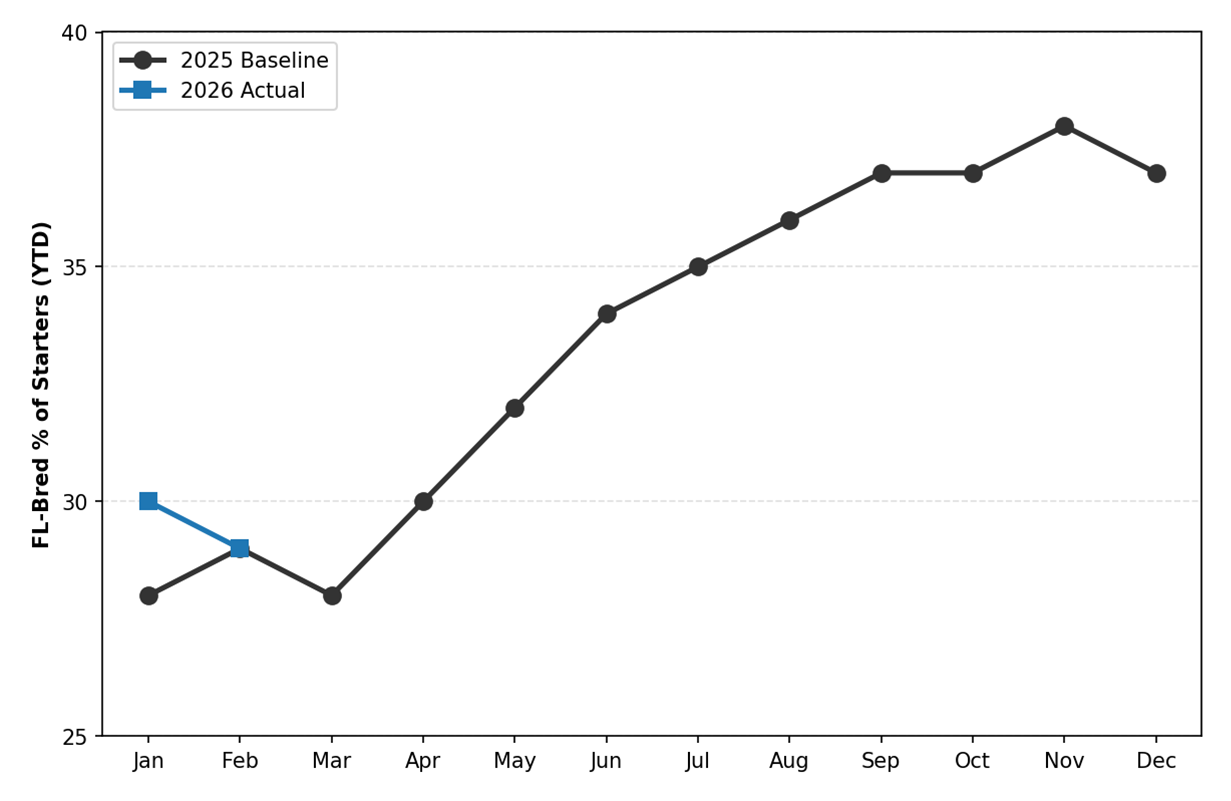
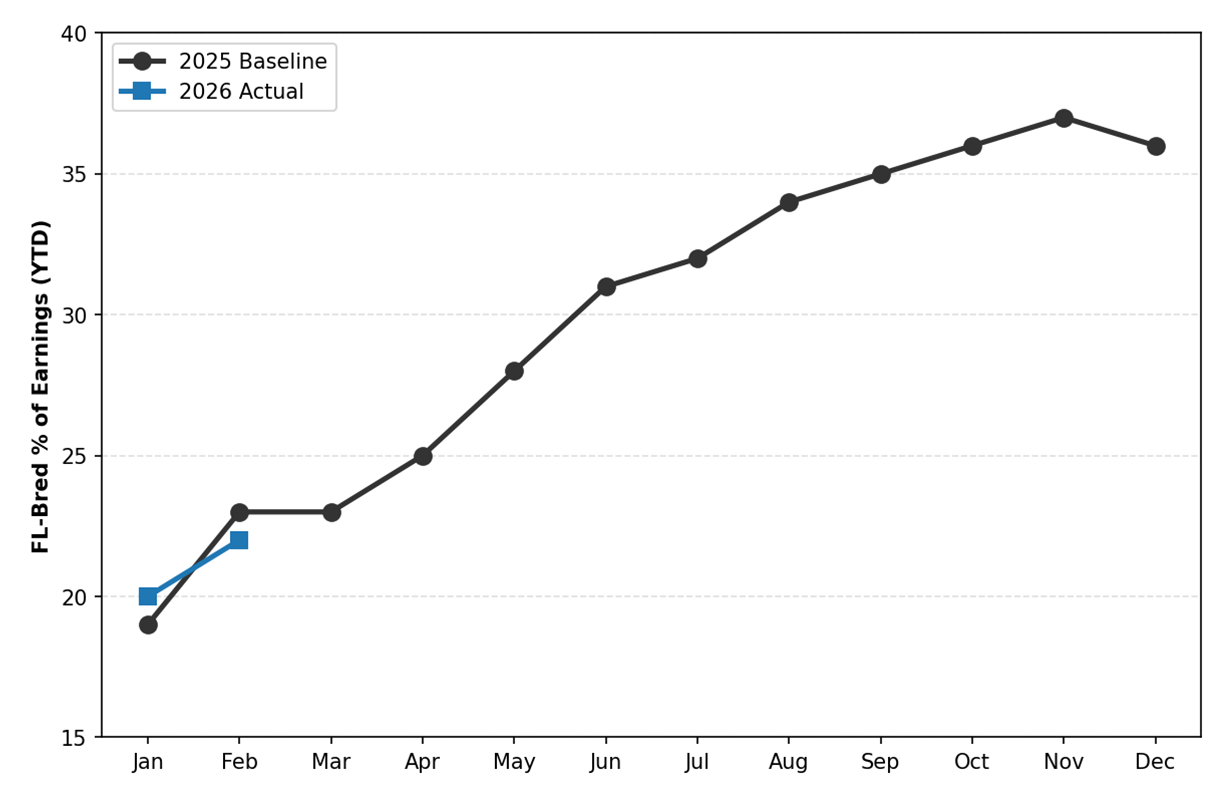
Each track has a four-panel dashboard. Panels one and two show Florida-bred cumulative (racemeet-to-date, or year-to-date) market share by participation rates (% of all runners), and earnings (% of all earnings), compared to prior seasons’ patterns.
Panels three and four track Florida-bred earnings against state-enhanced expectations. Panel three shows cumulative earnings building through the year. Panel four, labeled “Year-to-Date vs Baseline”, is the key chart. It isolates where the new state investment produces additional earnings:
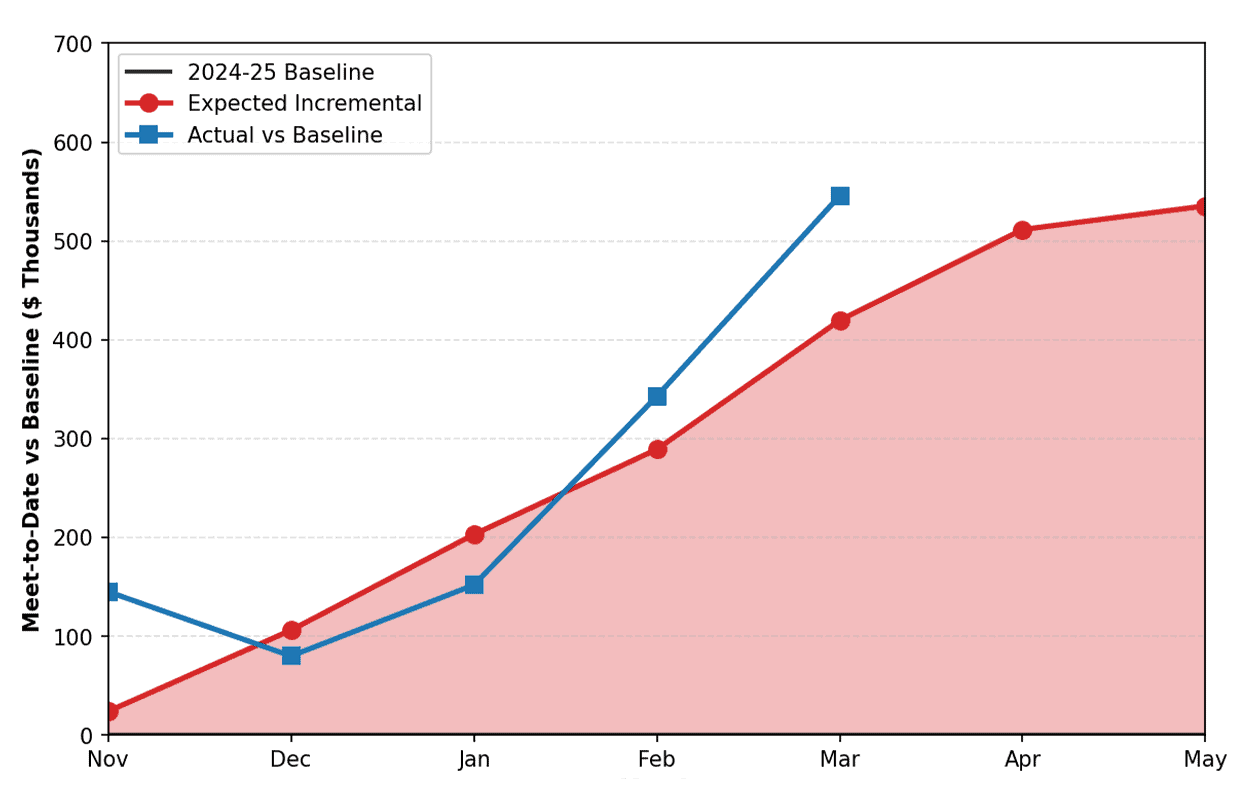
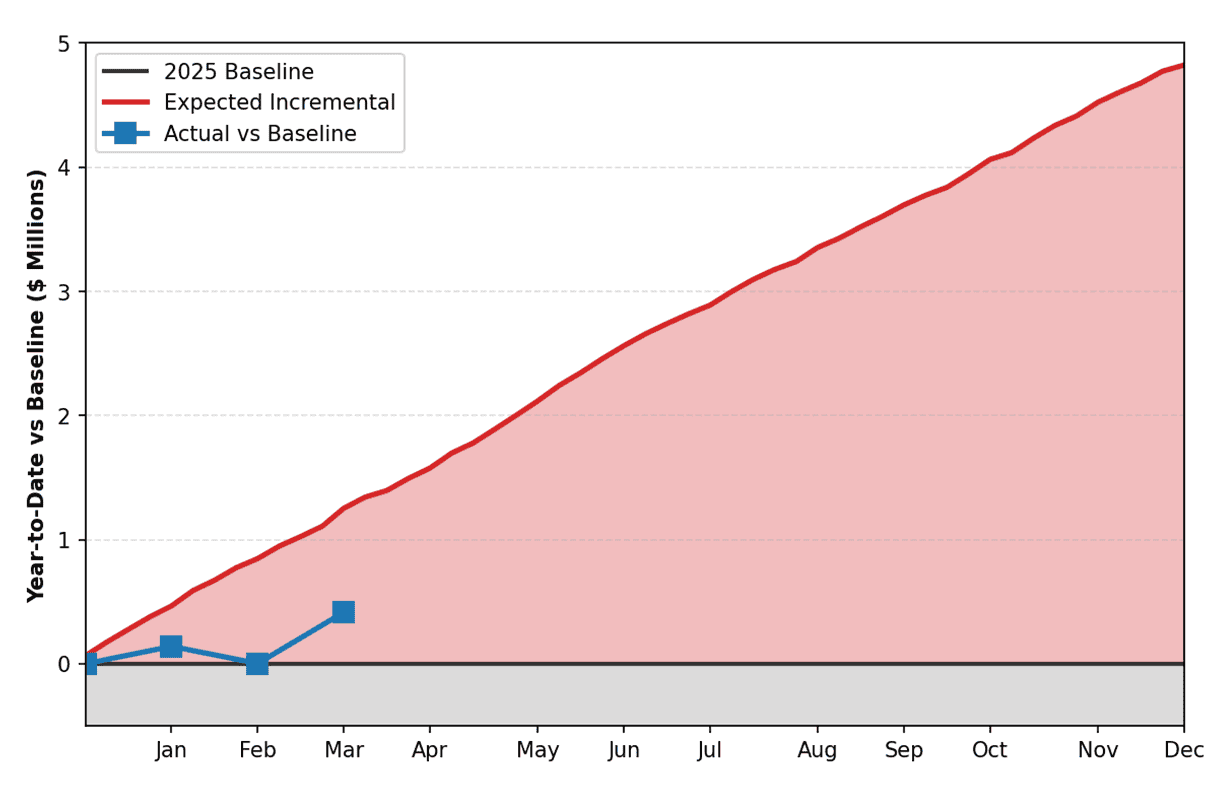
- Red represents expected incremental earnings from the state allocation, proportioned across the year.
- The blue line exhibits how far actual Florida-bred earnings have risen above the prior-year baseline, a gap that widens or narrows depending on weekly performance.
Where the blue line tracks the red area, the new state investment has translated to additional Florida-bred earnings. If the blue line falls short, the new money may have not yet materialized.
Context: Participation and Earnings Share
Tampa Bay Downs
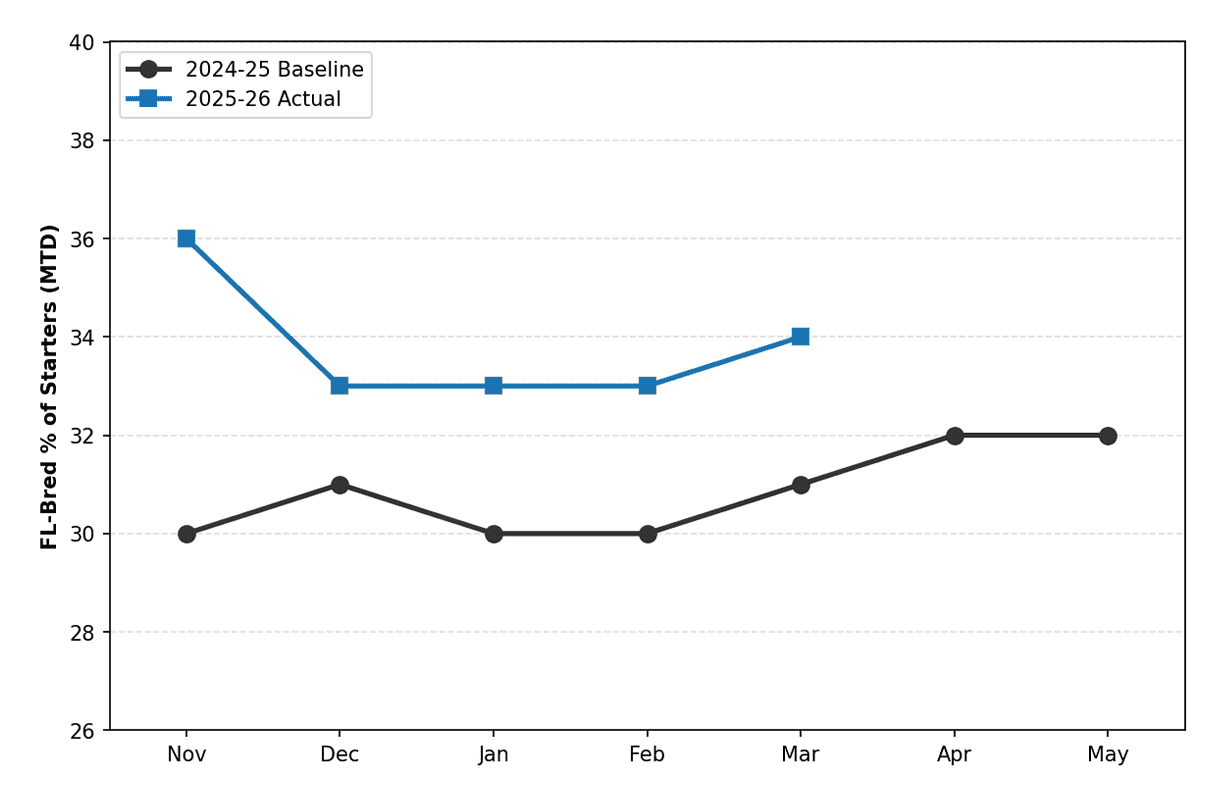
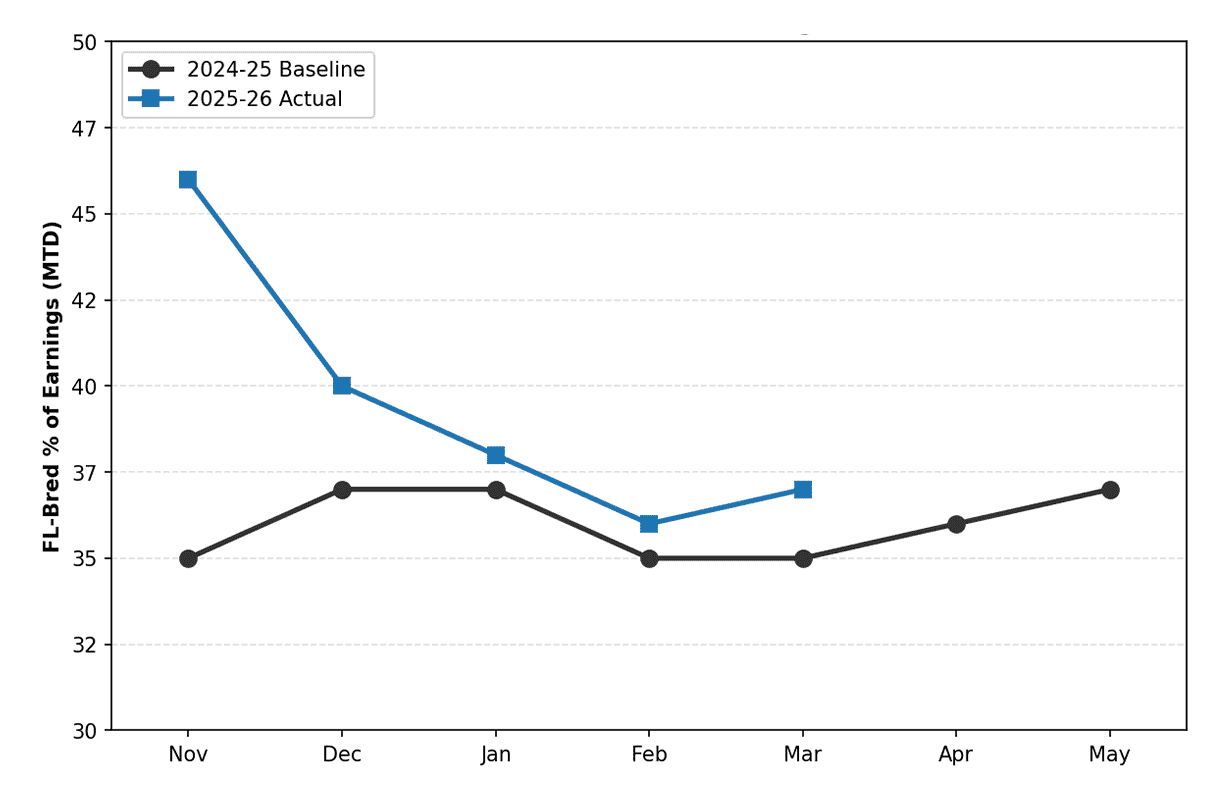
Florida-breds represent 34% of starters through March and 37% of earnings. Both metrics are tracking above the 2024-25 baseline. Total purse distributions are up 3% year-over-year, but the Florida-bred component has picked up 9%, driven by a 17% earnings gain in all overnight conditions.
FL-Bred Market Share
Meet-to-Date Through March 2026
1. Market Share: Runners
2. Market Share: Earnings
Gulfstream Park
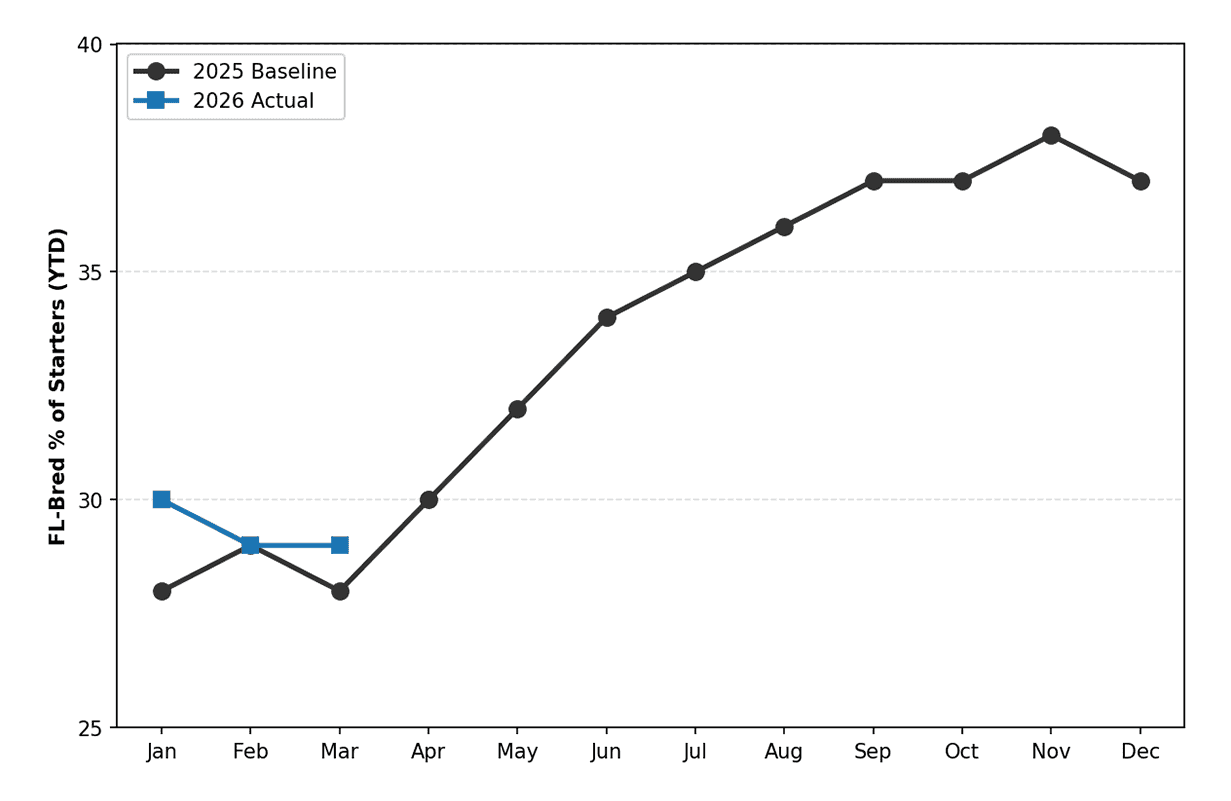
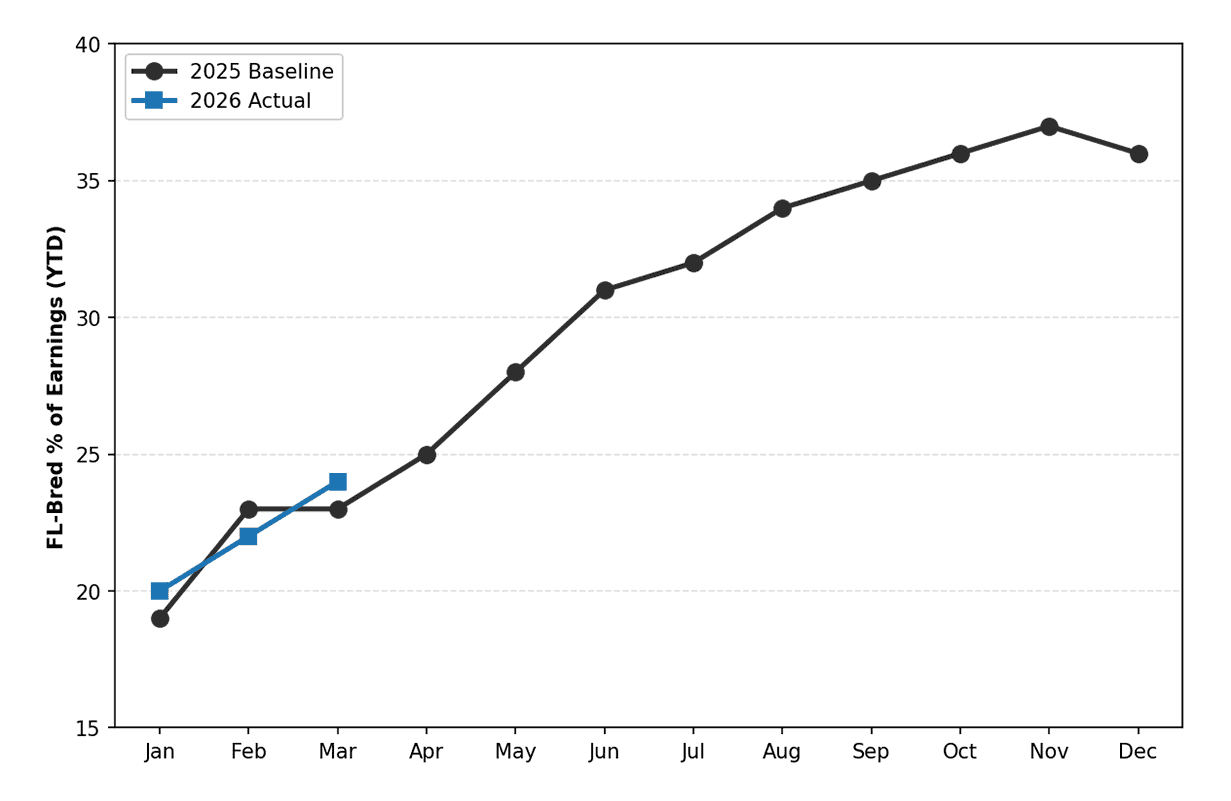
Florida-breds represent 29% of starters through March and 24% of earnings, both within a point of baseline.
FL-Bred Market Share
Meet-to-Date Through March 2026
1. Market Share: Runners
2. Market Share: Earnings
Results: Earnings vs. Expectations
Tampa Bay Downs
At Tampa Bay Downs, Florida-breds have earned $6.94 million – $126,000 ahead of the expected pace and pulling away. In practice, tracks budget to finish below the expected line, carrying contingency into the following year. Tampa Bay Downs’ Florida-breds have other plans.
3. Cumulative Earnings ($8.7M Expected)
4. Meet-to-Date vs. Baseline ($536K Expected)
Gulfstream Park
At Gulfstream Park, Florida-breds have earned $7.90 million – $416,000 ahead of baseline but $838,000 behind the expected pace. The trend is positive: after running essentially flat against baseline through February, March diminished the gap.
3. Cumulative Earnings ($33.6 M Expected)
4. Year-to-Date vs. Baseline ($4.8M Expected)
Gulfstream Park and the Florida HBPA have announced commitments to expand opportunities for Florida-breds. On April 25, Gulfstream Park will spur state-bred earnings with six Florida-bred stakes races totaling $600,000 in purses.
MONTHLY UPDATES
We will update this report monthly, comparing actual Florida-bred earnings against the anticipated trajectory.
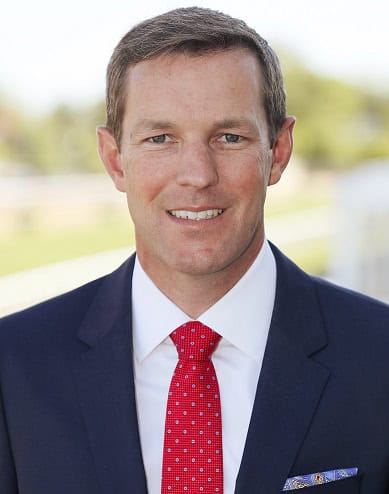
Steve Koch
Steve Koch is Administrative Vice President and industry economist for the Florida Thoroughbred Breeders’ and Owners’ Association.
FEBRUARY 2026
The State Investment
The Florida Legislature moved $5 million into racetrack purses for Florida-bred racehorses in 2026 – $4 million to Gulfstream Park and $1 million to Tampa Bay Downs.
Some of that state funding was already flowing in prior years. After accounting for preexisting allocations and reserves, the net new investment is $4.8 million at Gulfstream Park and $536,000 at Tampa Bay Downs.
FTBOA is tracking how this investment translates into additional earnings for Florida-breds.
The Framework
We start with what Florida-breds earned at each track before the new state money arrived. That’s the baseline.
Adding the new state allocation to the baseline gives us the expected 2026 Florida-bred earnings. Because earnings don’t accumulate evenly through the year – some months have more racing, richer stakes, or different field compositions – we proportion the expected trajectory to match the historical weekly pattern rather than assuming a straight line. Baselines are adjusted where schedule changes affect comparability.
TAMPA BAY DOWNS
• 2024-25 meet baseline: $8.2 million
• Plus net new state allocation: $536,000
• 2025-26 Expected Florida-Bred Earnings:
$8.7 MILLION
GULFSTREAM PARK
• Adjusted 2025 baseline: $28.8 million
• Plus net new state allocation: $4.8 million
• 2026 Expected Florida-Bred Earnings:
$33.6 MILLION
Gulfstream Park’s baseline is adjusted to remove Q1 Wednesday race dates (discontinued in 2026) and the discontinued Florida Sire Stakes 2-year-old series.
Reading the Charts
Each track has a four-panel dashboard. Panels one and two show Florida-bred cumulative (racemeet-to-date, or year-to-date) market share by participation rates (% of all runners), and earnings (% of all earnings), compared to prior seasons’ patterns.
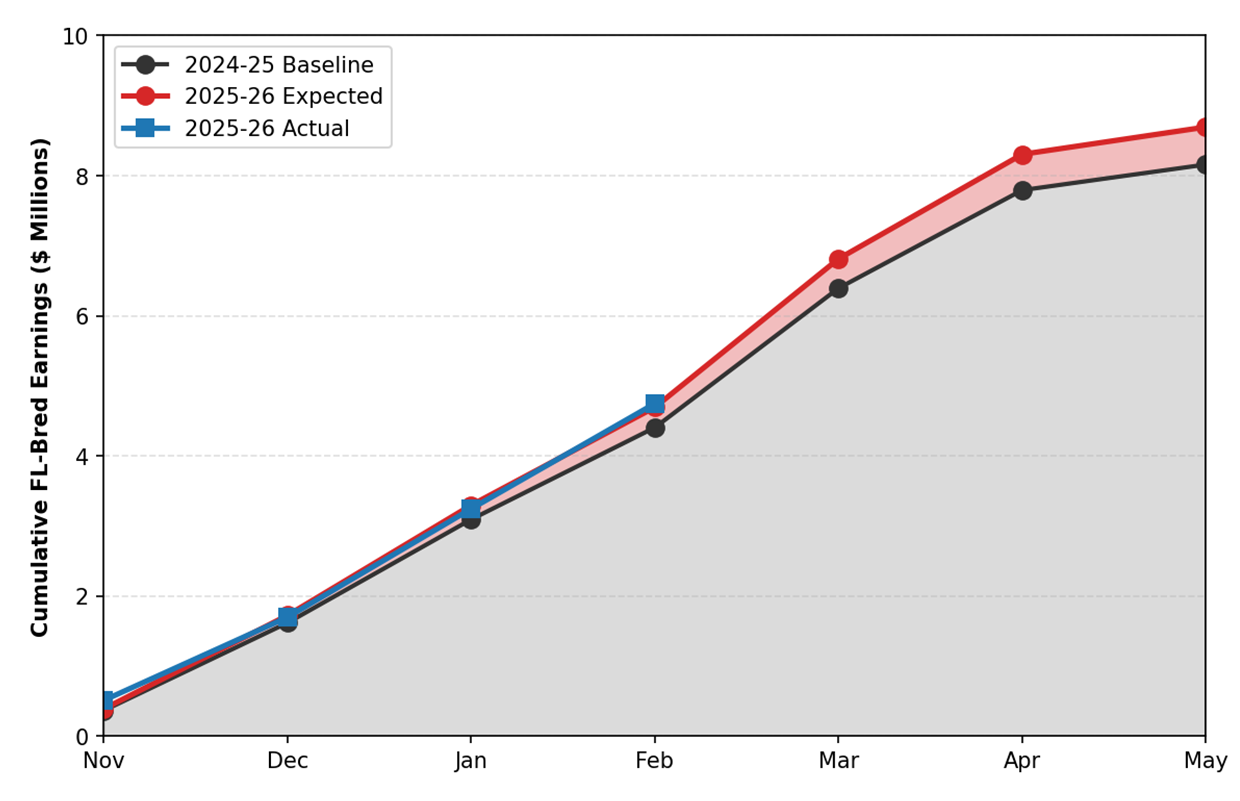
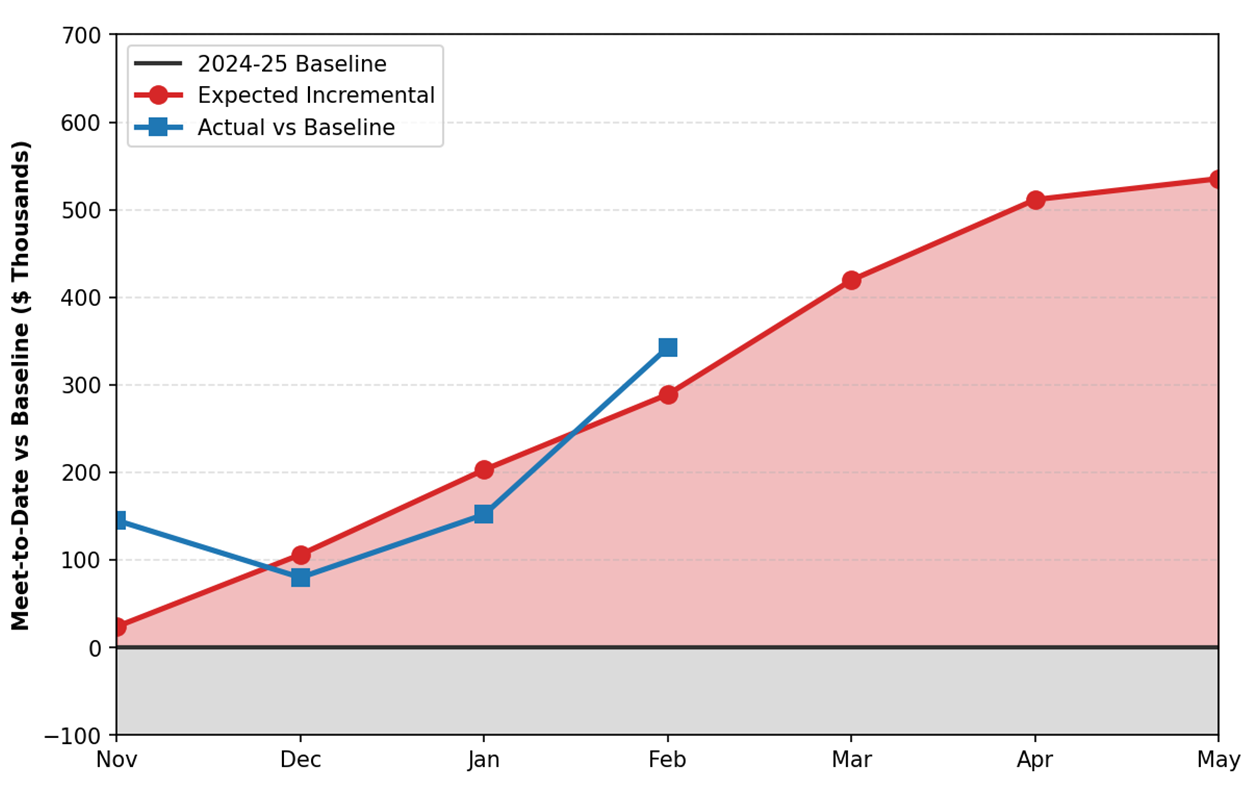
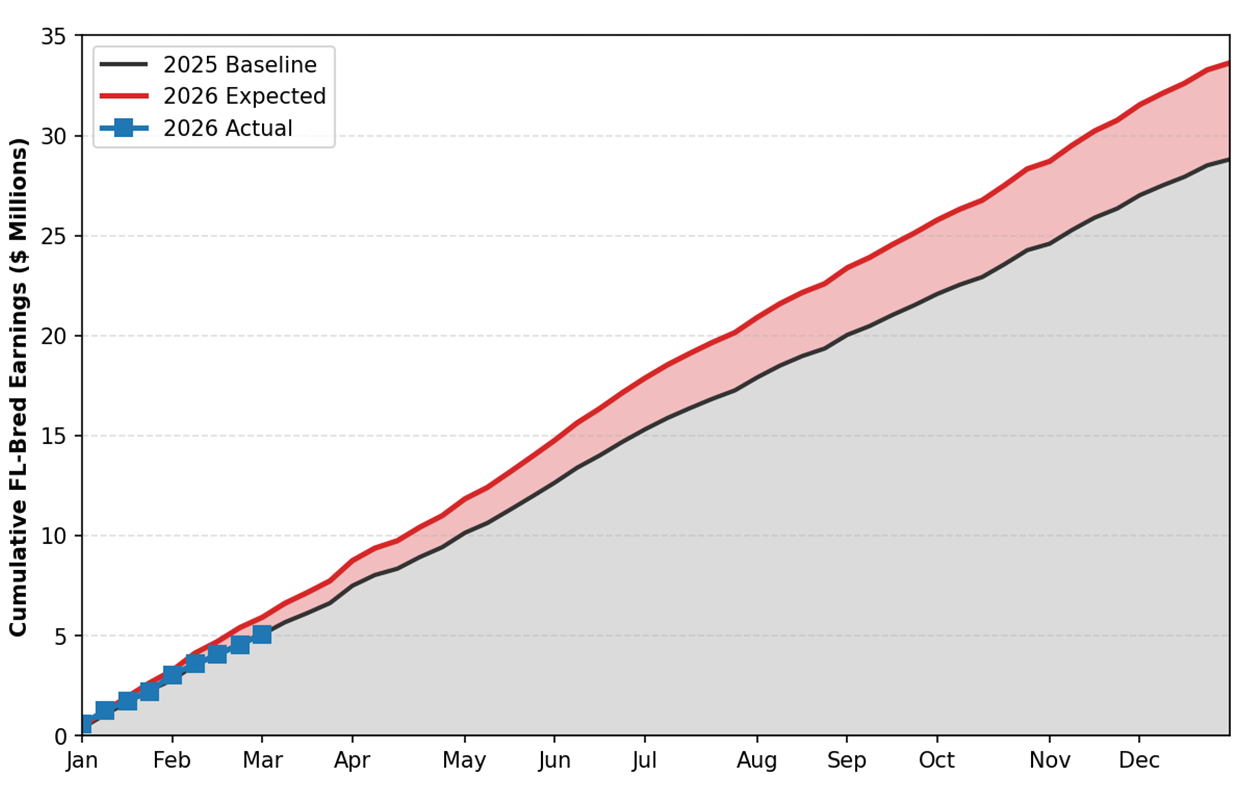
Panels three and four track Florida-bred earnings against state-enhanced expectations. Panel three shows cumulative earnings building through the year. Panel four, labeled “Year-to-Date vs Baseline”, is the key chart. It isolates where the new state investment produces additional earnings:
- Red represents expected incremental earnings from the state allocation, proportioned across the year.
- The blue line exhibits how far actual Florida-bred earnings have risen above the prior-year baseline – a gap that widens or narrows depending on weekly performance.
Where the blue line tracks the red area, the new state investment has translated to additional Florida-bred earnings. If the blue line falls short, the new money may have not yet materialized.
Context: Participation and Earnings Share
Tampa Bay Downs
Florida-breds represent 33% of starters through February and 36% of earnings. Both metrics are tracking above the 2024-25 baseline.
1. Market Share: Runners
2. Market Share: Earnings
Gulfstream Park
Florida-breds represent 29% of starters through February, matching the 2025 baseline. However, earnings share at 22% dips below the prior year.
1. Market Share: Runners
2. Market Share: Earnings
Results: Earnings vs. Expectations
Tampa Bay Downs
At Tampa Bay Downs, Florida-breds have earned $4.75 million – $343,000 ahead of baseline and $54,000 ahead of the expected pace.
3. Cumulative Earnings ($8.7 M Expected)
4. Meet-to-Date vs. Baseline ($536K Expected)
Gulfstream Park
At Gulfstream Park, Florida-breds have earned $5.07 million – essentially flat against baseline and $846,000 behind the expected pace.
3. Cumulative Earnings ($33.6 M Expected)
4. Year-to-Date vs. Baseline ($4.8M Expected)
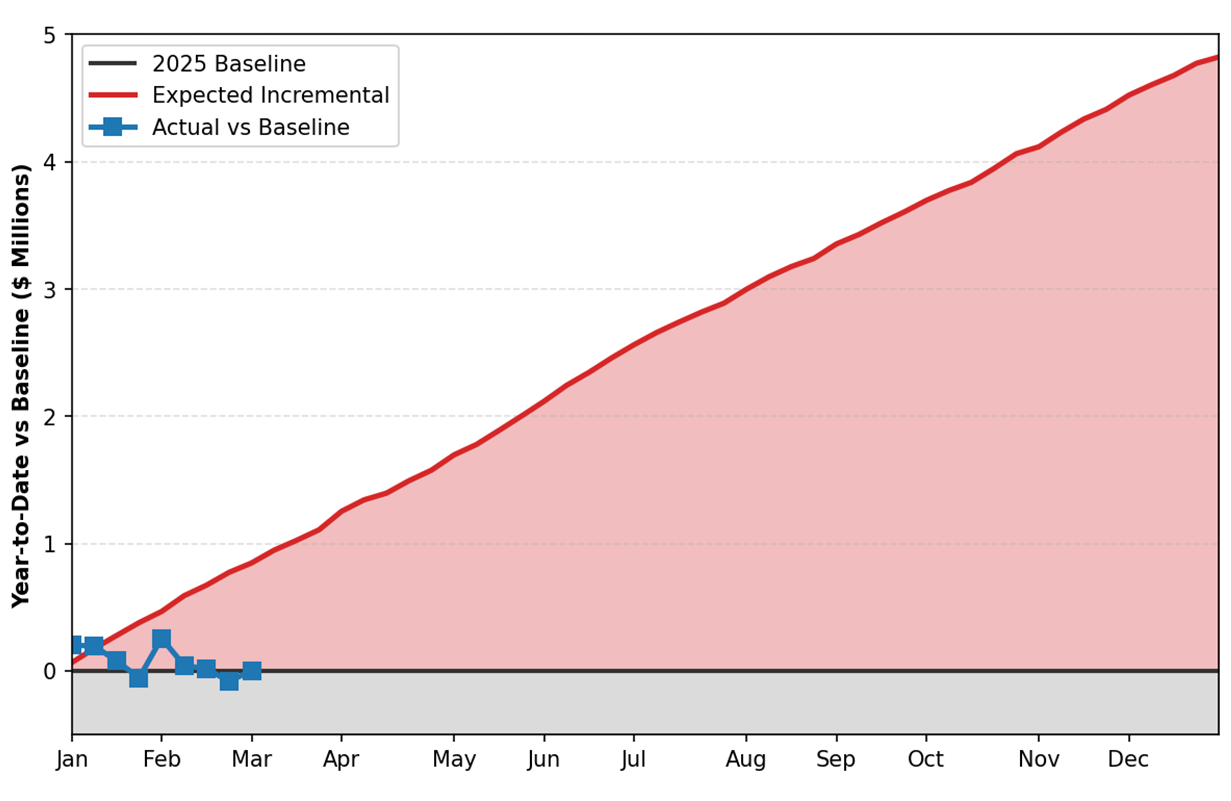
Gulfstream Park and the Florida HBPA have acknowledged their responsibility to expand opportunities for Florida-breds, though new Florida-bred earnings have yet to materialize.
Steve Koch
Steve Koch is Administrative Vice President and industry economist for the Florida Thoroughbred Breeders’ and Owners’ Association.
JANUARY 2026
The State Investment
The Florida Legislature moved $5 million to racetrack purses for Florida-bred racehorses in 2026 – $4 million to Gulfstream Park and $1 million to Tampa Bay Downs.
Some of that state funding was already flowing in prior years. After accounting for preexisting allocations and reserves, the net new investment is $4.8 million at Gulfstream Park and $536,000 at Tampa Bay Downs.
FTBOA is tracking how this investment translates into additional earnings for Florida-breds.
The Framework
We start with what Florida-breds earned at each track before the new state money arrived. That’s the baseline.
Adding the new state allocation to the baseline gives us the expected 2026 Florida-bred earnings. Because earnings don’t accumulate evenly through the year – some months have more racing, richer stakes, or different field compositions – we proportion the expected trajectory to match the historical weekly pattern rather than assuming a straight line. Baselines are adjusted where schedule changes affect comparability.
TAMPA BAY DOWNS
• 2024-25 meet baseline: $8.2 million
• Plus net new state allocation: $0.5 million
• 2025-26 Expected Florida-Bred Earnings:
$8.7 MILLION
GULFSTREAM PARK
• Adjusted 2025 baseline: $30.0 million
• Plus net new state allocation: $4.8 million
• 2026 Expected Florida-Bred Earnings:
$34.8 MILLION
Reading the Charts
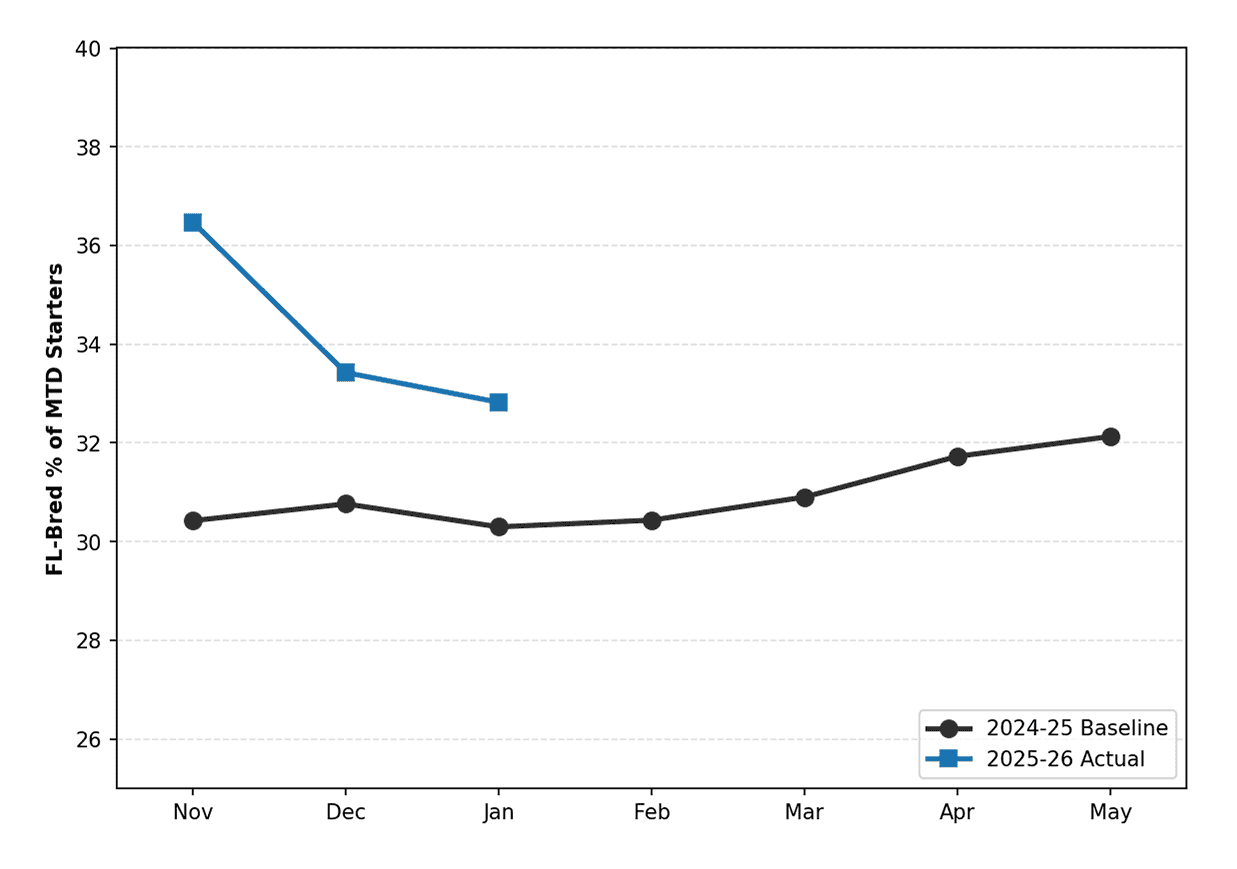
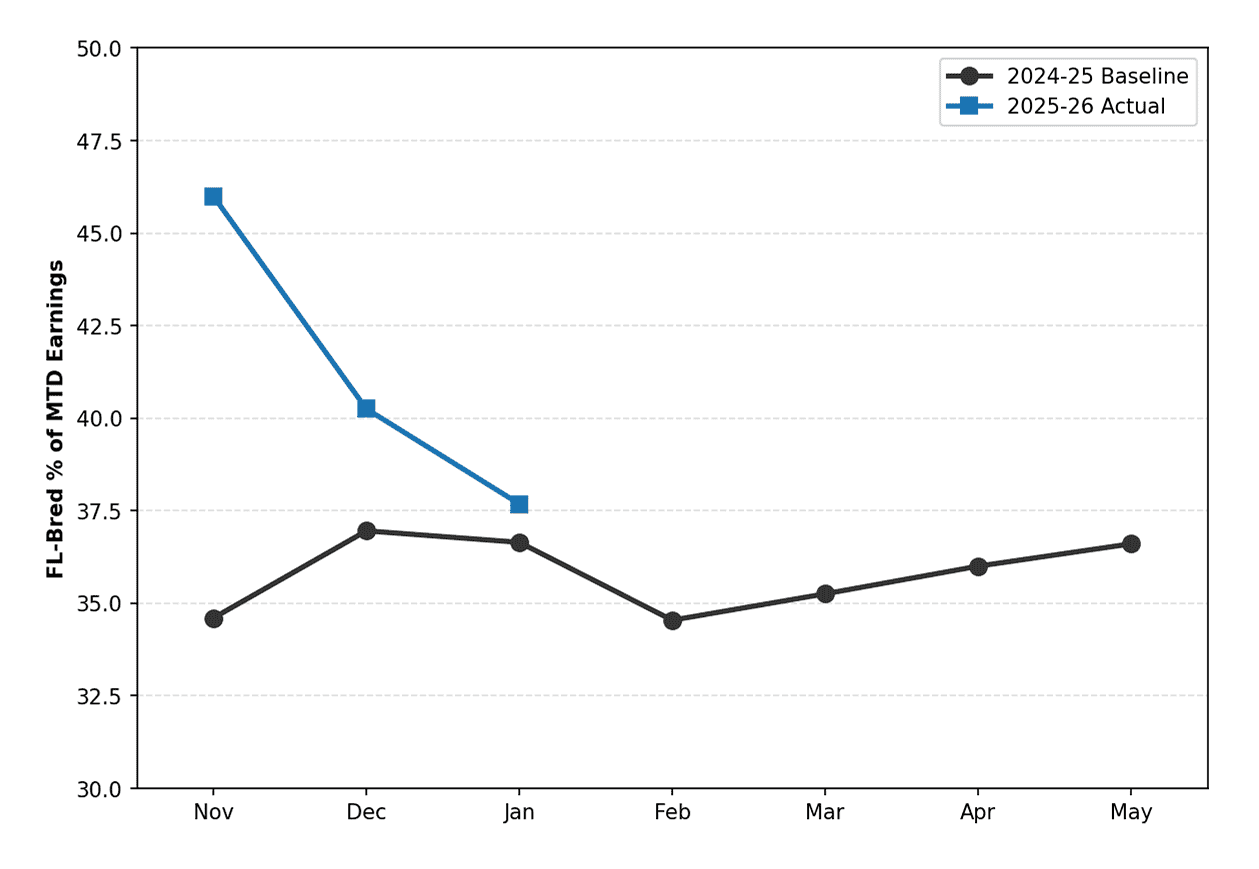
Each track has a four-panel dashboard. Panels one and two show Florida-bred market share by participation rates (% of all runners), and earnings (% of all earnings), compared to historical patterns.
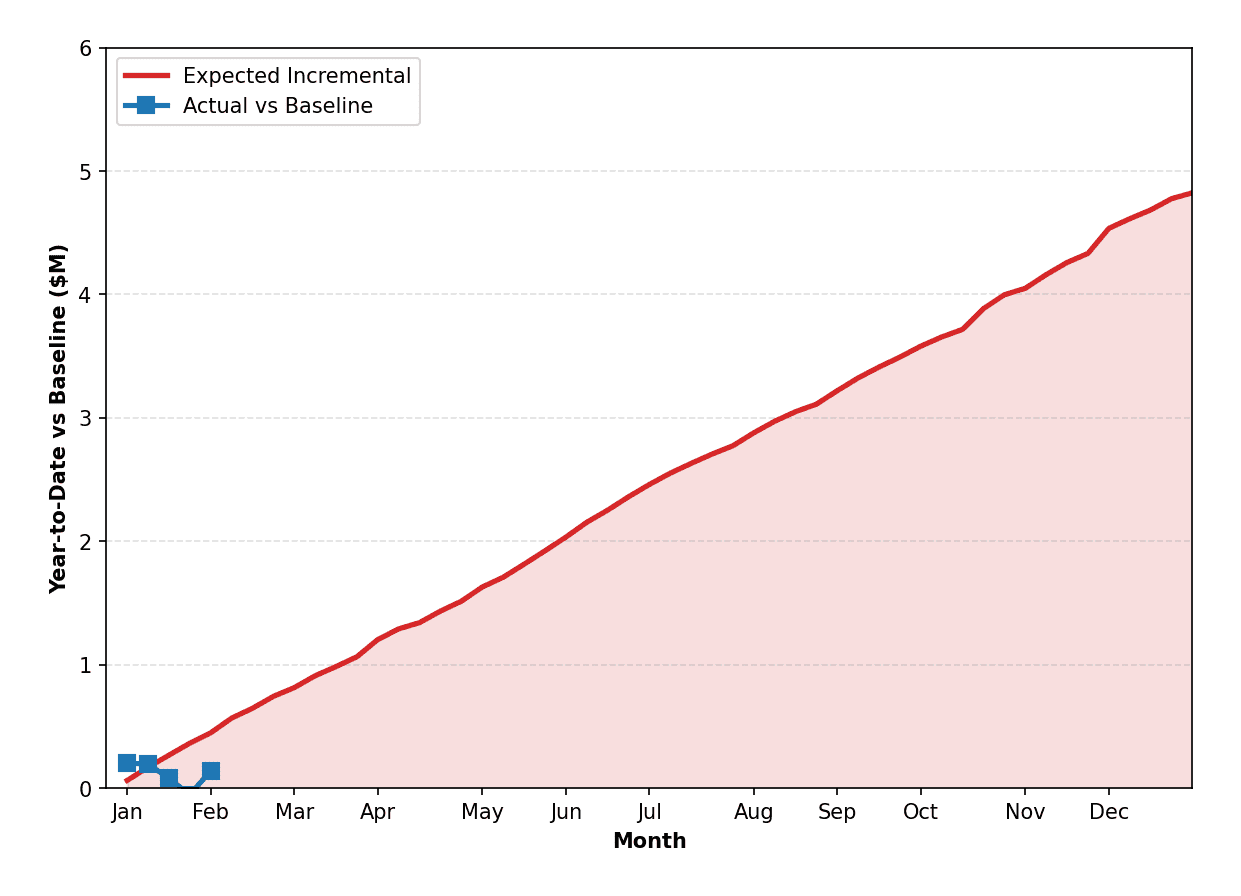
- The red shaded area represents expected incremental earnings from the state allocation, proportioned across the year.
- The blue line exhibits how far actual Florida-bred earnings have risen above the prior-year baseline — a gap that can widen or narrow depending on weekly performance.
Where the blue line tracks the red area, the state investment has translated to additional Florida-bred earnings. If the blue line falls short, the new money may have not yet materialized.
Context: Participation and Earnings Share
We track Florida-bred participation and earnings share to provide context for results.
Tampa Bay Downs – Florida-breds represent 32.8% of January starters (up from 30.3% last January) and 37.7% of January earnings (up from 36.6% one year ago).
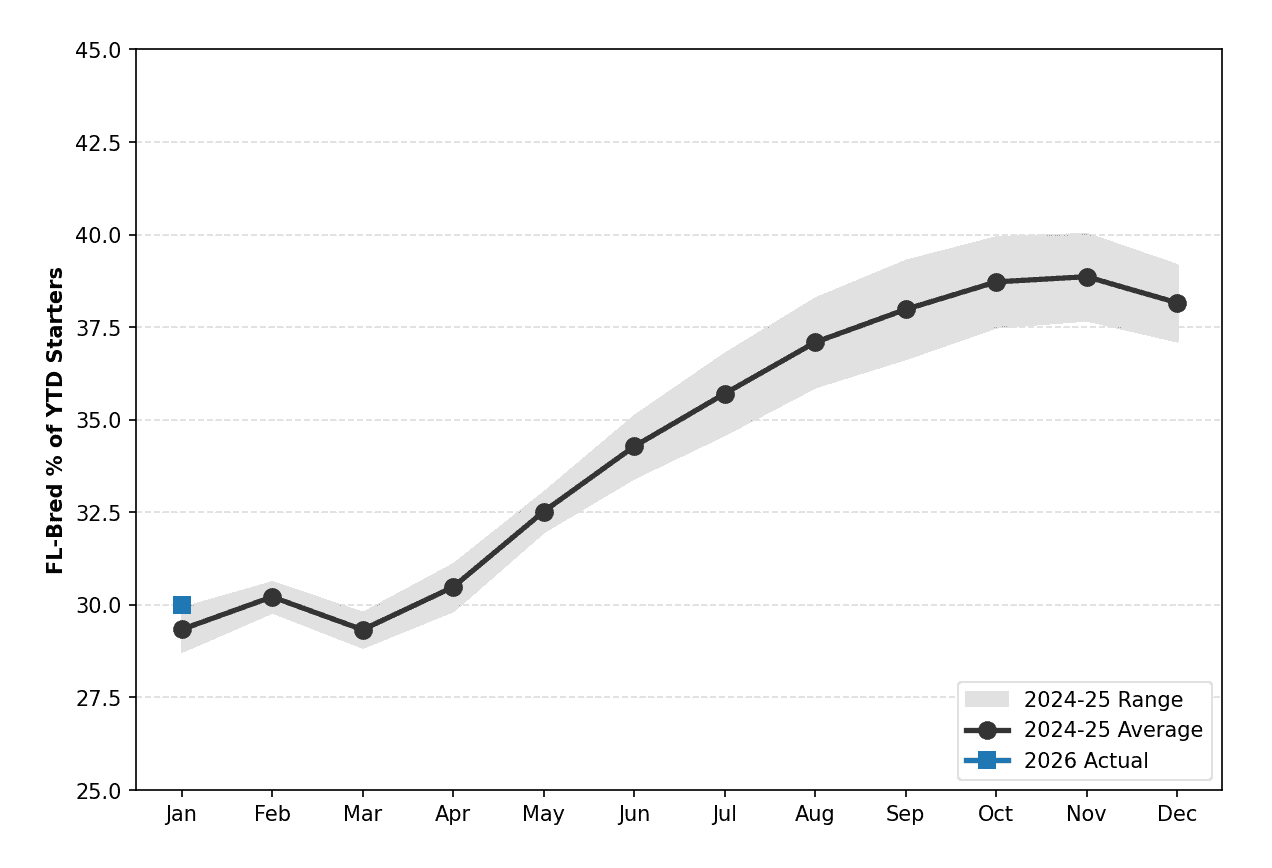
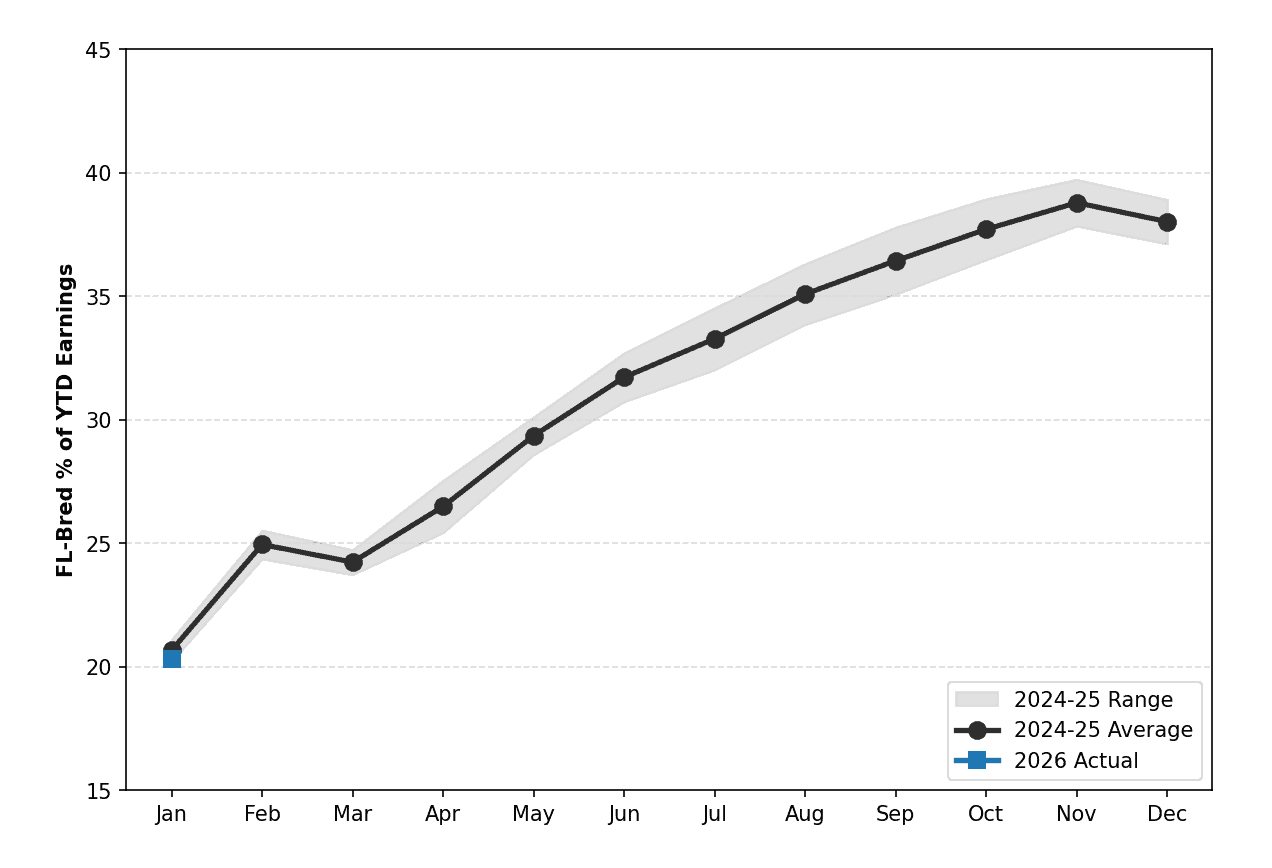
Gulfstream Park – Florida-breds represent 30% of January starters (steady with prior years) and 20.3% of January earnings (consistent with the historical range).
TAMPA BAY DOWNS
1. Market Share: Runners
2. Market Share: Earnings
Tampa Bay Downs
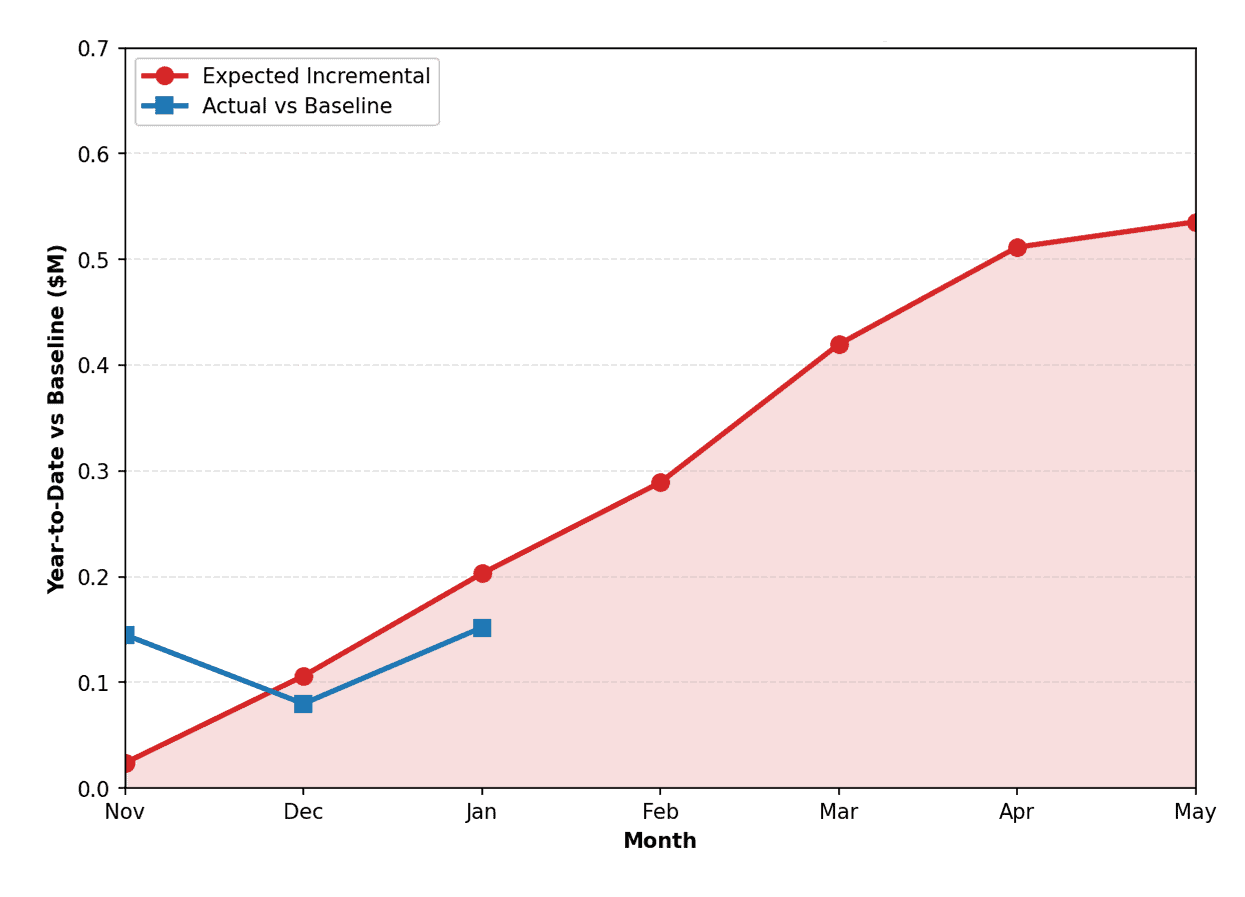
Through three months (November-January), Florida-breds have earned $3.24 million – $152,000 ahead of the prior-year baseline but slightly trailing the expected pace by only $51,000.
3. Cumulative Earnings ($8.7M Expected)
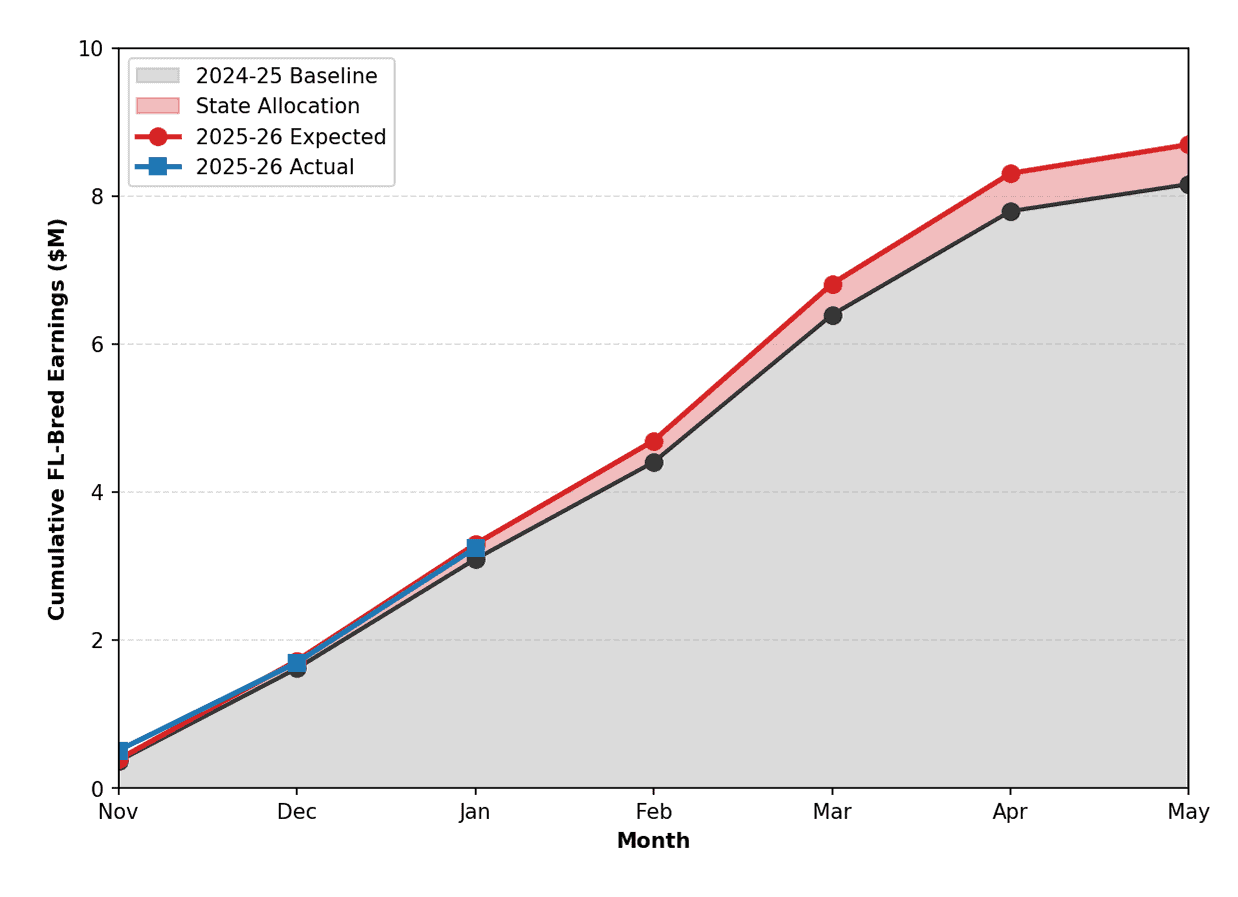
4. Year-to-Date vs. Baseline ($0.54M Expected)
GULFSTREAM PARK
1. Market Share: Runners
2. Market Share: Earnings
Gulfstream Park
Through January, Florida-breds have earned $2.93 million – ahead of the prior-year baseline by $141,000 but trailing the anticipated pace by $307,000.
3. Cumulative Earnings ($34.8M Expected)
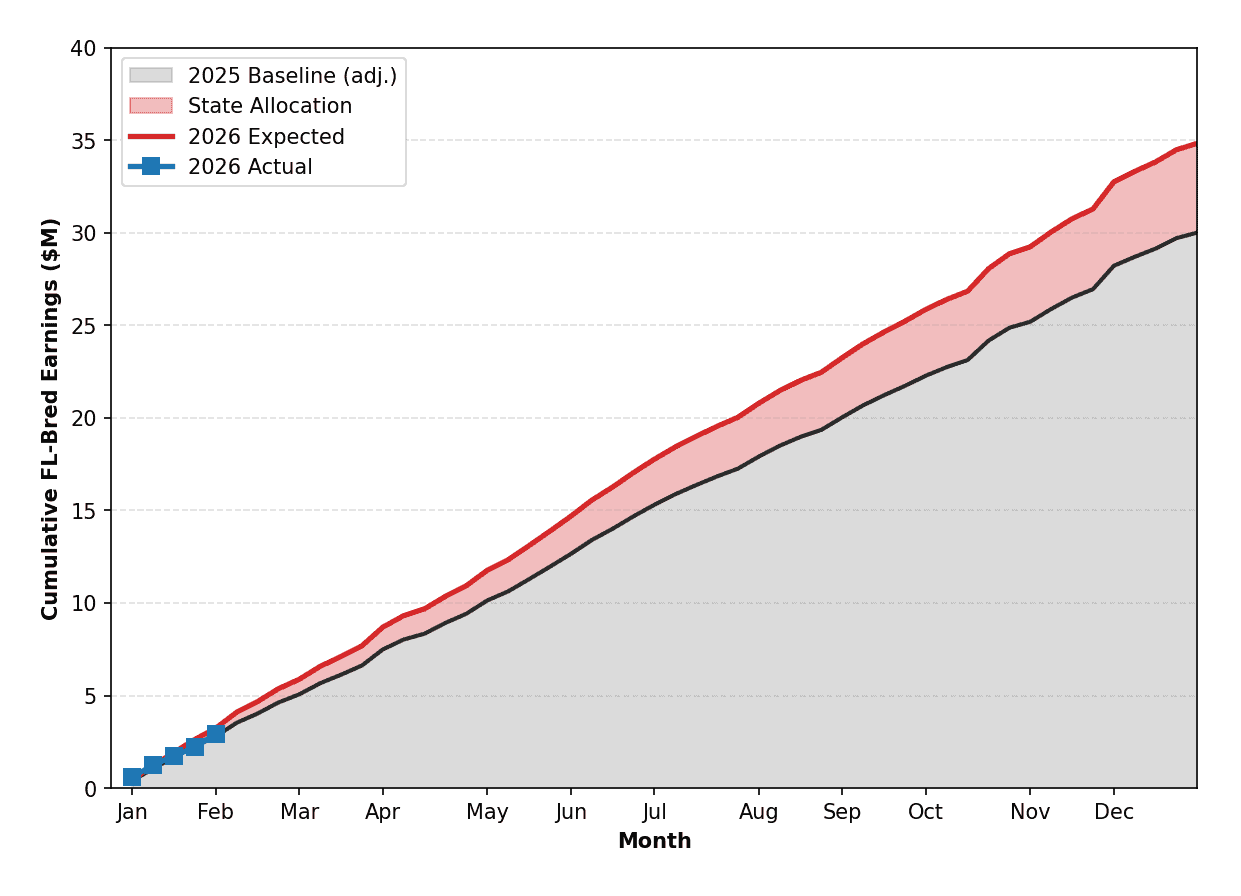
4. Meet-to-Date vs. Baseline ($4.8M Expected)
Steve Koch
Steve Koch is Administrative Vice President and industry economist for the Florida Thoroughbred Breeders’ and Owners’ Association.
MONTHLY UPDATES
We will update this report monthly, comparing actual Florida-bred earnings against the anticipated trajectory.